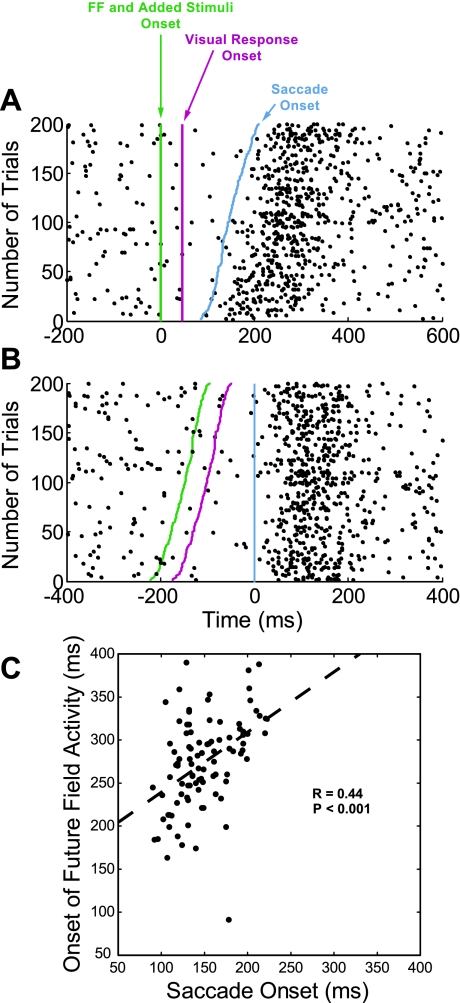
Fig. 7.
FF activity is better aligned to saccade onset than FF stimulus onset. A: each row on the raster plot represents spikes on 1 trial for the example cell; the trials are plotted in ascending order of saccade latency with the shortest latency at the bottom. The neuronal activity is aligned to the onset of the FF stimulus and added stimuli (green vertical line). The increased activity occurred long after the visual latency for this neuron (47 ms, indicated by dashed vertical red line) and followed the saccade onset (blue line). B: the same neuronal activity but aligned to the saccade onset. Note the difference in time scales between A and B. C: the onset of the FF activity plotted against the onset of the saccade for the data presented in A. Onset times are with respect to the onset of the FF stimulus and added stimuli. There was a significant linear relationship between the onset of the FF activity and the onset of the saccade (R = 0.44, P < 0.001).

