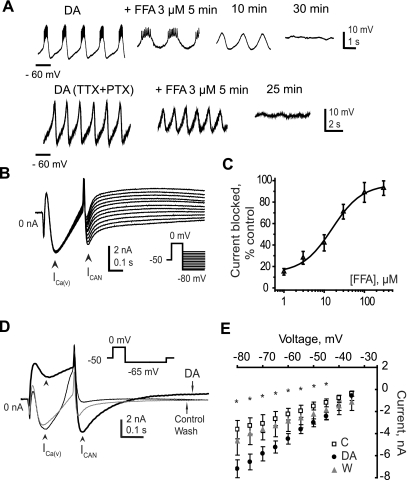
Fig. 5.
Calcium-activated inward current ICAN is a likely target of DA modulation. A: flufenamic acid (FFA) abolishes DA oscillations in a synaptically isolated AB neuron. Top: the AB neuron was isolated by photoablation, and bursting was evoked with 10−4 M DA. Bottom: the AB neuron was isolated from modulatory and synaptic input by application of 10−7 M TTX + 5 × 10⁻⁵ M PTX, and oscillations were evoked with 10−4 M DA. In both cases, 3 μM FFA stopped oscillations within 30 min. B: properties of ICAN in the AB neuron: the current is measured during voltage-clamp recordings as a slowly deactivating tail current evoked by an activating prestep to 0 mV and a series of hyperpolarizing steps (inset at right, voltage protocol). Arrowheads on the current traces mark the peak voltage-gated calcium current [ICa(V)] activated by the depolarizing prestep and the peak ICAN tail currents measured after repolarization of the cell. C: dose-response curve for FFA block of ICAN (IC50 = 24.7 ± 5 μM; n = 4). The amplitude of the blocked current was normalized by the corresponding control current amplitude. D: DA enhances the amplitude of ICAN while inhibiting ICa(V). Voltage-clamp current traces under control conditions (thin black trace), during application of 10−4 M DA (thick black trace), and after 30 min of washout (thin gray trace). DA inhibited ICa(V) while enhancing ICAN amplitude (arrowheads). Current traces are not leak subtracted. The voltage protocol used to measure ICAN is shown in the small inset. E: ICAN current-voltage relationship under control conditions (C, open squares), in the presence of DA (filled circles), and after washout (W, gray triangles). All data points are means ± SE. Asterisks mark the voltage steps where the difference between control and DA was statistically significant (n = 8, P < 0.05, Student's t-test).

