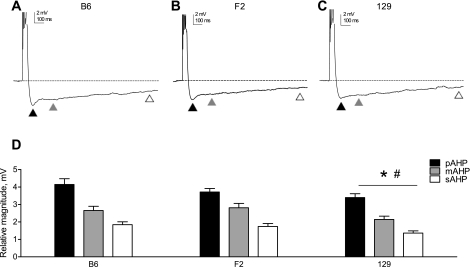
Fig. 1.
Genetic background affects the magnitude of the AHP. A–C: a representative trace of the afterhyperpolarization (AHP) evoked at −60 mV (by a 50-ms current injection sufficient to elicit 5 action potentials) is shown for each genetic background examined: B6 (A), F2 (B), and 129 (C). In all panels, the dashed line represents the baseline membrane potential before current injection and the triangles indicate different phases of the AHP as follows: peak AHP (pAHP; solid triangles), medium AHP (mAHP; shaded triangles), and slow AHP (sAHP; open triangles). Note that action potentials are truncated for clarity. D: group data (means ± SE) indicating the magnitudes of the pAHP, mAHP, and sAHP in each genetic background (B6, n = 28; F2, n = 35; 129, n = 29). The asterisk indicates a significant difference compared with B6, and the pound sign indicates a significant difference compared with F2 (P = 0.02, 1-factor repeated-measures ANOVA with Newman-Keuls post hoc test).

