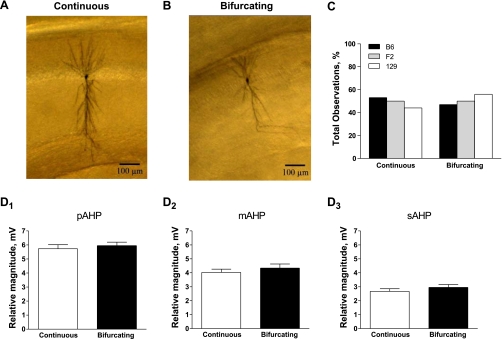
Fig. 4.
AHP magnitude is not differentially affected by the morphology of the primary apical dendrite. A and B: magnification of the cells shown in Fig. 3. After DAB processing, cells could be readily divided into 2 groups based on whether the primary apical dendrite remained continuous (A) or bifurcated (B) within stratum radiatum. C: the distribution of continuous (B6, n = 9; F2, n = 19; 129, n = 8) vs. bifurcating primary apical dendrites (B6, n = 8; F2, n = 16; 129, n = 10) did not differ between genetic backgrounds (P = 0.43, χ2). D: a Student's t-test comparing the magnitude of each phase of the AHP (mean ± SE) showed that the pAHP (D1; P = 0.57), mAHP (D2; P = 0.41), and sAHP (D3; P = 0.30) were not different between neurons with continuous (n = 36) or bifurcating primary apical dendrites (n = 34). Because there were no differences across genetic background (see C), data from B6, F2, and 129 animals are combined in these graphs.

