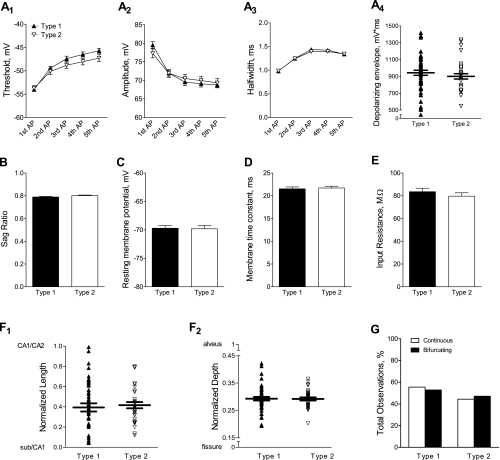
Fig. 6.
Investigation of neuronal properties and morphological characteristics that may contribute to differences in the shape of the AHP waveform. Because the shape of the AHP waveform was not differentially affected by genetic background (see Fig. 5), the data were combined for the following analysis. For A–F, type 1 AHPs are represented by solid symbols or bars (n = 57) and type 2 AHPs are represented by open symbols or bars (n = 35). A: the threshold (A1), amplitude (A2), and half-width (A3), shown as means ± SE, were measured for each of the 5 action potentials in the burst stimulus used to evoke the AHP. A 1-factor repeated-measures ANOVA revealed no differences between type 1 and type 2 AHPs (P = 0.21 for threshold, P = 0.99 for amplitude, and P = 0.67 for half-width). The depolarizing envelope for the burst stimulus (A4), calculated as the integrated voltage from current onset to current offset, is shown for individual cells with the mean ± SE indicated by horizontal lines. A Student's t-test revealed no difference between AHP types (P = 0.34). B–E: a Student's t-test of the group data (means ± SE) revealed no differences between type 1 and type 2 AHPs for the sag ratio (B; P = 0.12), resting membrane potential (C; P = 0.90), membrane time constant (D; P = 0.28), or input resistance (E; P = 0.37). F: the location of each cell body on the length axis (F1) and the depth axis (F2) was plotted for type 1 and type 2 AHPs. The mean position was not different for type 1 vs. type 2 AHPs (length axis, P = 0.58; depth axis, P = 1.0; Student's t-test). G: neither type 1 (n = 38) nor type 2 (n = 32) AHPs were preferentially associated with a continuous or bifurcating primary apical dendrite (P = 0.83, χ2).

