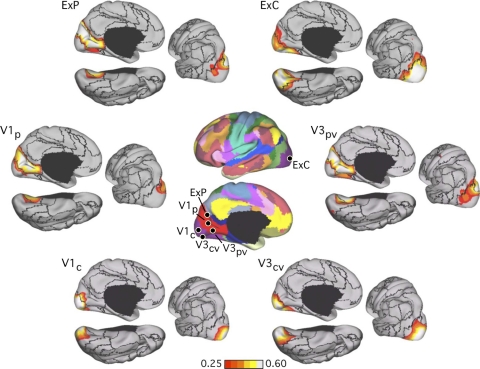
Fig. 16.
Evidence that the fractionation of the visual system reflects functional connectivity MRI (fcMRI) topography within the visual cortex. Six left hemisphere seed regions were picked from the discovery dataset: V1c and V1p correspond to central and peripheral visual field representation within V1, respectively; V3cv and V3pv correspond to central and peripheral V3v, respectively; ExC and ExP correspond to 2 seed regions within the extrastriate visual cortex in the estimated locations of the central and peripheral visual fields (purple and bright red at center). The 6 seed regions are illustrated at center, and their coordinate locations are reported in Table 1. Their left hemisphere fcMRI maps were computed using the replication data set and arranged around the center images. Note that the central visual seed regions are selectively correlated with the central visual representation, whereas the peripheral visual seed regions are selectively correlated with the peripheral visual representation.

