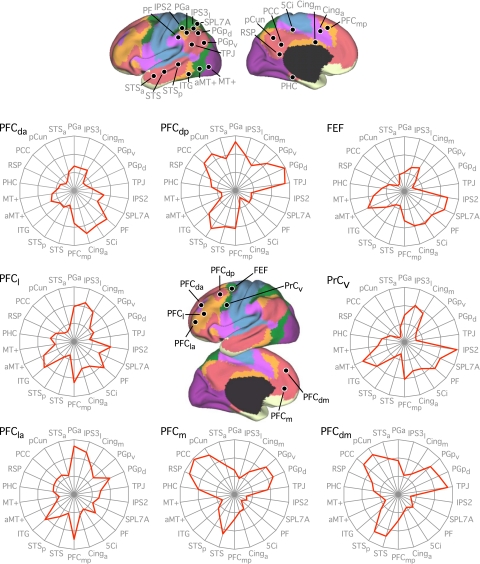
Fig. 31.
Adjacent frontal regions exhibit distinct functional connectivity fingerprints. The format and plotting are the same as for Fig. 30 with regions tailored for exploration of frontal cortex. The coordinate locations are reported in Table 4. The polar scales range from r = −0.4 (center) to r = 0.5 (outer boundary) in 0.3-step increments.

