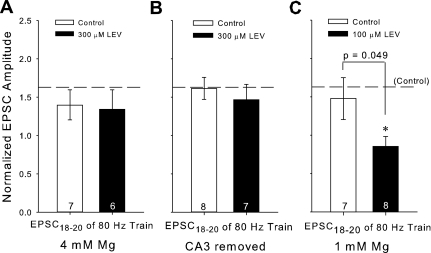
Fig. 9.
Factors that affect the amount of spontaneous activity in a slice during LEV incubation can prevent or facilitate LEV's effect. A, B, and C: averages of the normalized amplitudes of the 18th through 20th EPSCs for 80-Hz trains for slices incubated 3 h in 4 mM Mg ± 300 μM LEV (A), slices incubated 3 h with removed CA3 regions ± 300 μM LEV (B), or slices incubated 3 h in 1 mM Mg ± 100 μM LEV (C) compared with previous control averages (horizontal reference lines). All data shown are means ± SE (n = nos. shown in bar diagrams are from at least 4 different animals per group; P value from Student's t-test). *Significant difference.

