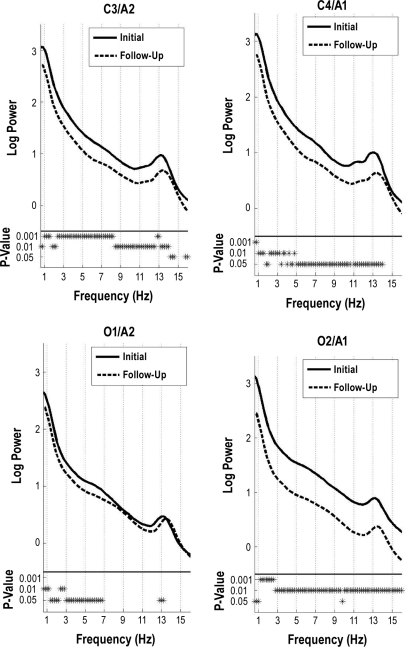
Figure 1.
All night NREM sleep spectra. Subject average NREM sleep spectra of the log power at 2 central (C3/A2 and C4/A1) and 2 occipital (O2/A1 and O1/A2) derivations. The solid line corresponds to data from the initial session, while the dashed line corresponds to data from the follow-up session. Significance at 3 different levels (P < 0.05, P < 0.01, and P < 0.001) is indicated at the bottom of each plot for each frequency bin by an asterisk. The frequency resolution was 0.2 Hz.

