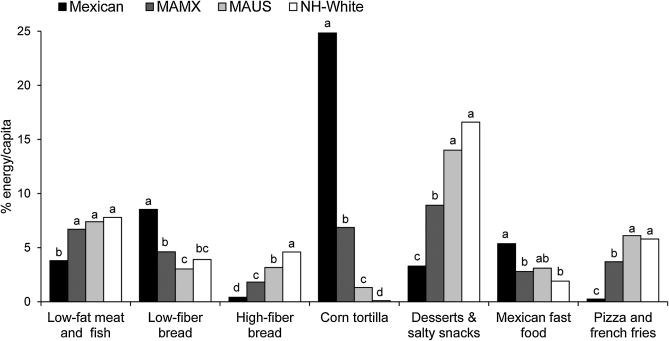
FIGURE 2.
Percentage energy per capita from food groups with a difference of at least ≥4% among any 2 subpopulations in Mexican (MNS 1999), MA, and NH-White (NHANES 1999-2006) adult women. n = 1978 (Mexican), 802 (MAMX), 486 (MAUS), or 2297 (NH-White). Percentages without a common letter differ, P < 0.01 (z-test with Bonferroni correction). MA, Mexican American; MAMX, Mexican American born in Mexico; MAUS, Mexican American born in the US; MNS, Mexican Nutrition Survey; NH-White, non-Hispanic white.

