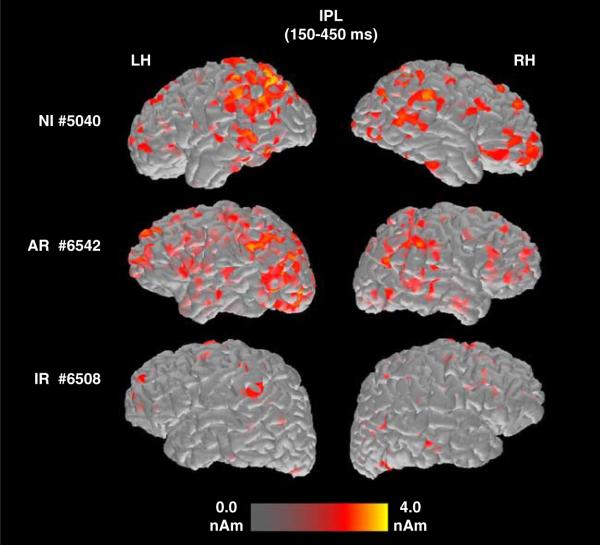
Fig. 2.
Baseline brain activation maps from three representative participants: a non-impaired reader (NI; top row), a student who later showed adequate response to intervention (AR; middle row), and a student who did not show adequate response (IR; bottom row). When these recordings were made, this AR student scored 87 and 77 points on the TOWRE Sight Word and Pseudoword reading efficiency subtests, respectively (1-year follow-up scores were 96 and 87 points). Corresponding scores for the IR student shown here, were 80/81 and 83/81 points. The relative intensity of activated voxels is shown at the bottom of the figure. Each set of images presents activity in inferior parietal (IPL) regions, comprised of the angular and supramarginal gyri, where significant group differences were observed, between 200–500 ms, in the left (LH) and right (RH) hemispheres.

