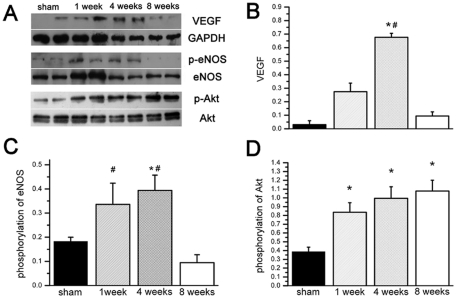
Figure 2. Alternation of angiogenesis signal in remote cardiac tissue at different time points.
A, Representative western blot results of VEGF, p-eNOS and p-Akt; B, After MI, VEGF protein expression is increased until 4 wks, and decreased significantly 8 wks post MI; C, Phosphorylation of eNOS is also significantly increased after MI. At 8 wks post MI, p-eNOS level is decreased significantly; D, Phosphorylation of AKT level is significantly increased after MI, but not reduced at 8 weeks post MI (n = 6). # P<0.05 compared by group of 8 wks post MI. * P<0.05 compared by sham group.

