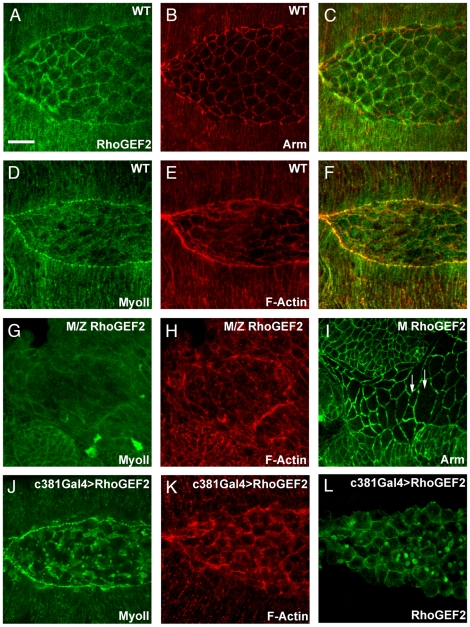
Figure 1. DRhoGEF2 plays a role in dorsal closure.
(A) Anti-DRhoGEF2 staining showing that this protein is expressed in WT AS cells, the image shows only the most apical confocal sections of the AS cells. (B) Anti-Armadillo marks cell outlines of the cells at the level of the adherens junctions. (C) Merged image showing DRhoGEF2 and Armadillo. (D) Anti-myosin II staining marks the actomyosin cable and the AS cells. (E) Phalloidin staining marks actin filaments at the leading edge cable and cortical actin. (F) Merged image showing colocalisation of actin filaments and myosin II. (G) Myosin II staining in DRhoGEF2 maternal zygotic mutants showing decreased levels of Myosin II. (H) Phalloidin staining showing that F-actin is also affected in DRhoGEF2 zygotic maternal mutants. (I) Armadillo staining of DRhoGEF2 maternal mutants exhibiting irregular actomyosin cables and abnormal AS cell shapes at different stages of dorsal closure. (J) Increased levels of MyoII in DRhoGEF2 overexpressing embryos. (K) Increased levels of F-actin in DRhoGEF2 overexpressing embryos. (L) Embryos overexpressing DRhoGEF2 specifically in AS cells stained for DRhoGEF2 to show the specificity of the driver. The scale bar represents 20 µm. During image acquisition we used the same parameters to allow the comparison of expression levels in different experiments.

