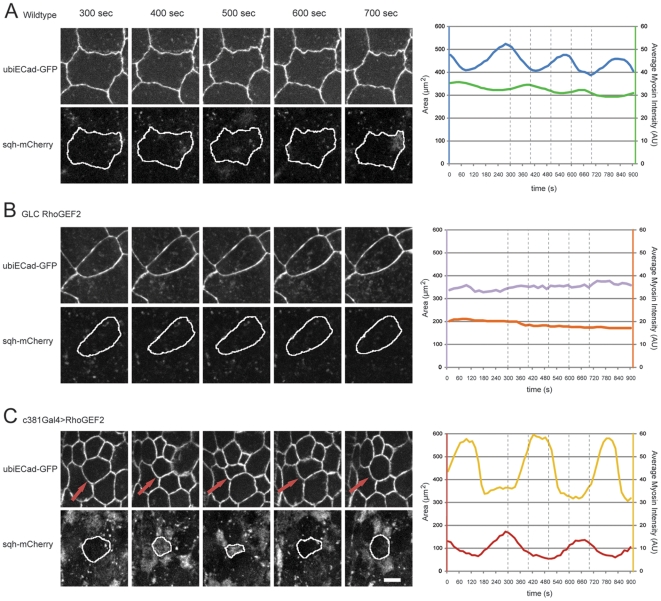
Figure 5. Pulsations in cell areas are asynchronous with fluctuations in actomyosin coalescence.
Still images of a representative AS cell expressing UbiDECad-GFP and Sqh-mCherry captured from time series of (A) Wild-type, (B) DRhoGEF2 maternal mutants, and (C) c381GAL4/UAS-DRhoGEF2, from stage 13 embryos. Cell areas were measured in the UbiDECad-GFP channel, and average intensity of myosin II was measured in Sqh-mCherry channel in the corresponding cell area. Quantified analyses from 15 second time intervals are presented. On each graph the lines corresponding to cell area and average myosin II intensity are colour coded according to the respective axis. The still images highlight maximum and minimum of cell area and myosin II intensity, and the time points are indicated in the graph by vertical dotted lines. Bar indicates 10 µm.

