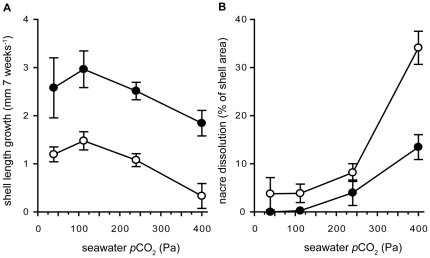
Figure 1. Shell length growth (A) and internal shell surface dissolution (B) vs. seawater pCO2.
(A) Shell length growth during the seven week growth trial. (B) Internal shell surface dissolution in % of total inner shell area; low food (LF, white) and high food (HF, black) groups, means and SEM. A seawater pCO2 of 100 Pa = 987 µatm.

