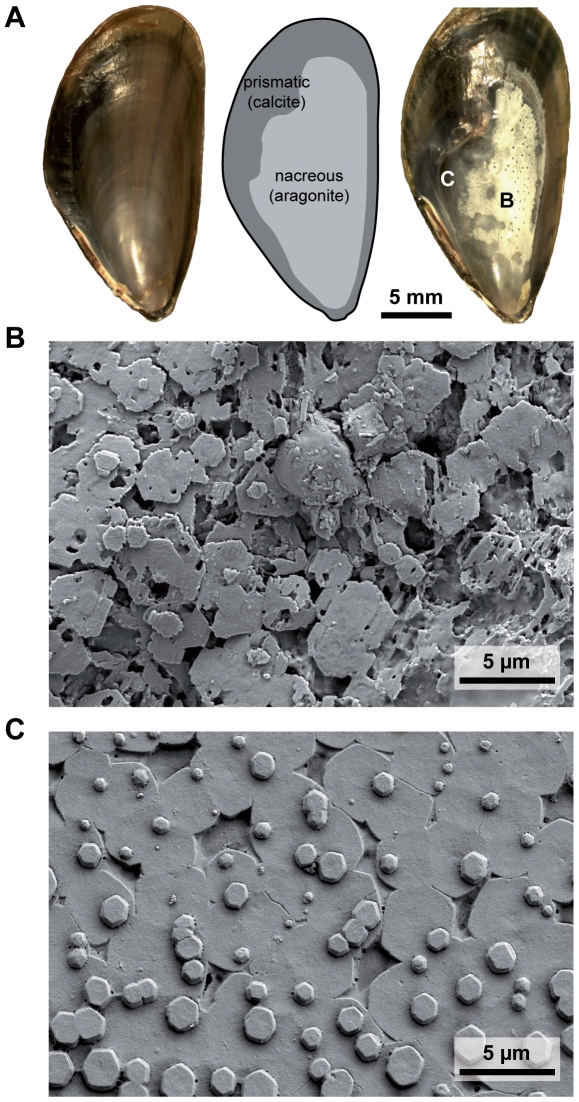
Figure 2. Internal shell dissolution of the nacreous layer.
(A) left: stereo microscopic image of the inner shell surface of a control (39 Pa, HF) mussel, middle: schematic drawing of the inner shell surface area of the same control shell to indicate extent of the nacreous layer, right: inner shell surface of a high pCO2 (405 Pa, LF) mussel. White areas correspond to corroded nacreous surface layers, darker areas to unimpacted nacreous surfaces. (B) SEM image of a severely corroded nacre surface corresponding to position (B) in Fig. 2A. (C) SEM image of control nacre surfaces, illustrating coordinated aragonite tablet growth (3 layers visible).

