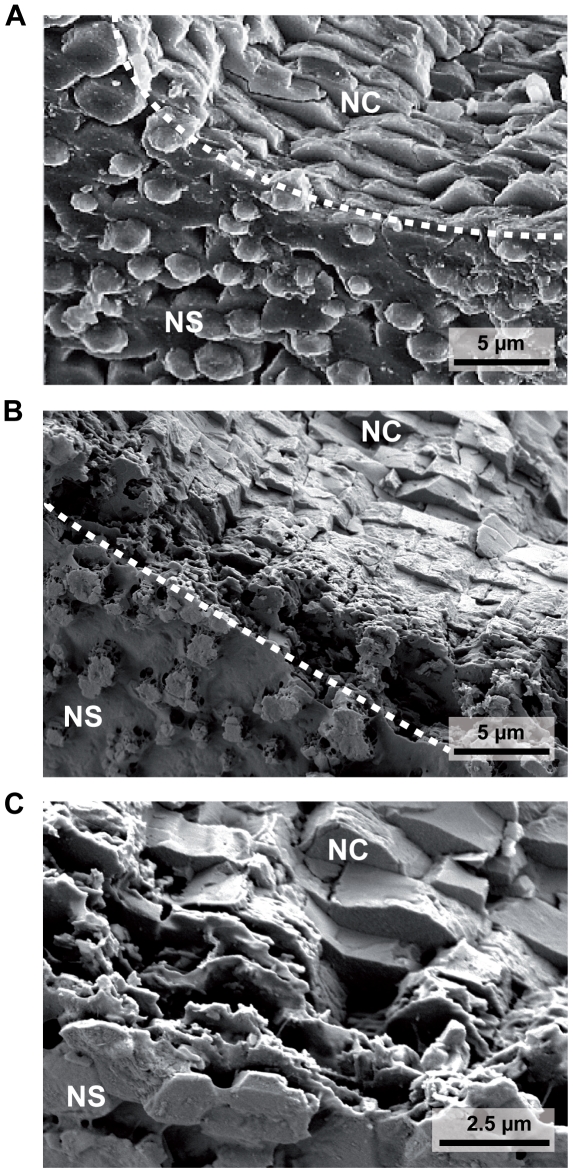
Figure 3. SEM images of shell cross sections of uncorroded (A) vs. corroded (B, C) nacreous tablet layers.
(A) cross section through uncorroded nacreous layer with growing nacre tablets on the surface. (B, C) cross sections through dissolved nacreous layers, illustrating extensive dissolution of plates ca. 3–5 µm deep into the nacreous layer. Deeper nacreous layers appear to be macroscopically unaffected. Corroded cross sections were obtained from the same mussel piece shown in Fig. 4A and B. The white dashed lines in A, B indicate the breaking edge, NS = nacreous layer surface, NC = nacreous layer cross section.

