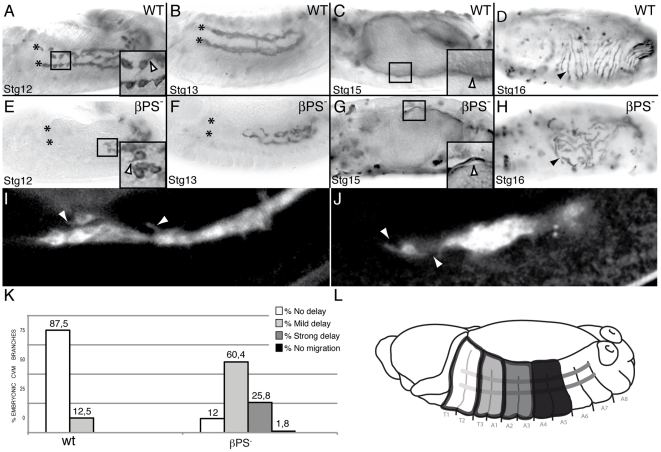
Figure 2. CVM migration is delayed in embryos lacking the βPS subunit.
(A–D) Wild type embryos and (E–H) βPS maternal and zygotic mutant embryos. CVM cells are visualized by the expression of the transmembrane protein CD2 driven by the CVM G447.2-GAL4 and detected with an anti-CD2 antibody. (A, B, E, F) During germ band retraction, βPS mutant CVM cells show a delay in their migration although they can still send projections as wild type cells do (arrowhead in magnification in black box). (G, H) At Stgs15 and 16, the longitudinal fibers of βPS mutant embryos detach from the underlying vm (G, arrowhead in magnification in black box) and do not spread properly (arrowhead, H). (I, J) Snap shots from live imaging recording embryos carrying the CVM 5053A-GAL4 driving src-GFP. Both wild type (I) and βPS mutant (J) CVM cells send projections (arrowheads) while migrating. (K) Quantification of the CVM migration phenotype in Stg13 embryos of the indicated genotypes. (L) Schematic diagram of a Stg13 embryo showing the distance reached by CVM cells. In all figures, asterisks mark the foregut-midgut transition, where CVM cells stop migrating.

