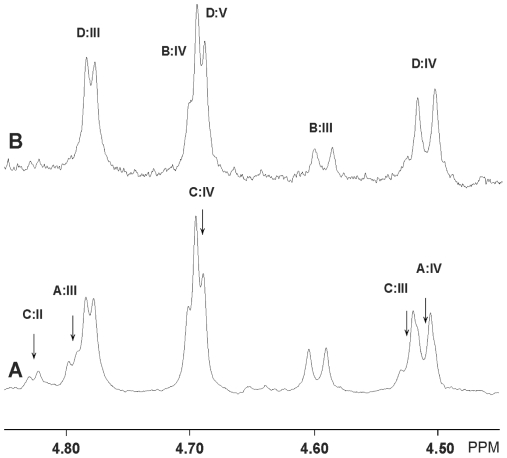
Figure 5. Proton NMR of fraction C:tetra-I and fraction C-tetra-II from chicken erythrocytes.
Low-field part of the anomeric regions of the 600 MHz spectra of fraction C:tetra-I (A) and fraction C-tetra-II (B). The arrows in (A) indicate which resonances that have disappeared in (B) and these are labeled according to the scheme in Table 1. Likewise, the remaining resonances in (B) are also labeled as in Table 1.

