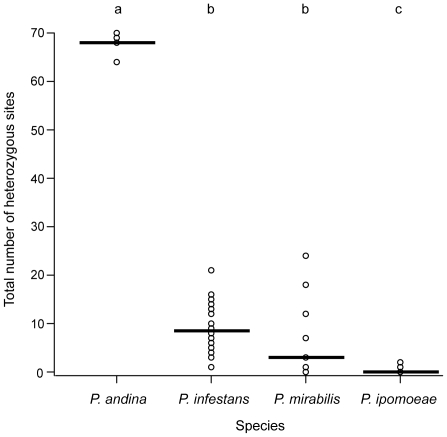
Figure 1. Total number of heterozygous sites across four nuclear loci sequenced in each isolate by species.
Lines represent mean values for each species and circles represent values of individual isolates (circles are overlapping). Lowercase letters above graph indicate significance, such that significantly different means (P<0.05) by Tukey's HSD are shown by different letters. The number of heterozygous sites observed in P. andina isolates was at least two to three times higher than isolates from the other species and P-values of comparisons with P. andina were less than 0.0001.

