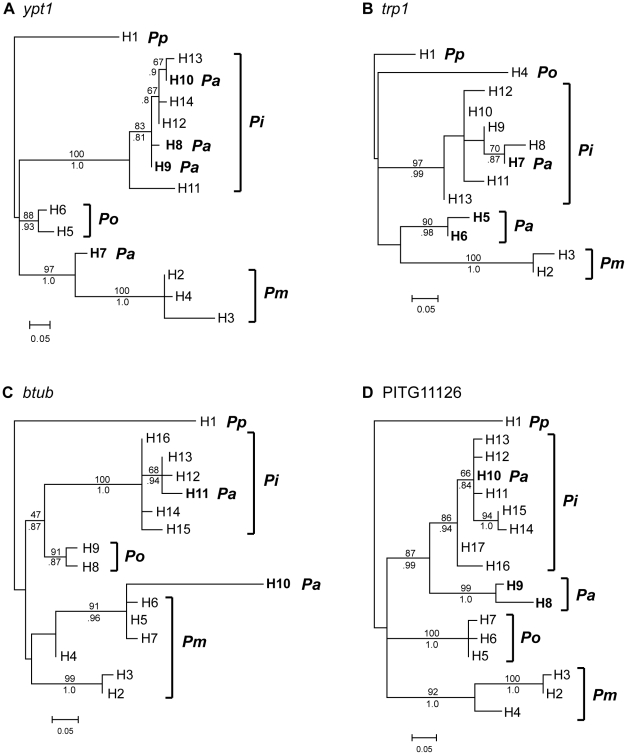
Figure 2. Maximum likelihood trees of haplotypes for each locus sequenced.
Loci are A. ypt1, B. trp1, C. btub, and D. PITG11126, sequenced in P. andina (Pa) and four other closely related species (Pi: P. infestans; Pm: P. mirabilis; Po: P. ipomoeae; and Pp: P. phaseoli). The haplotype designation is shown for each branch tip, corresponding to Tables 1, 2, and S1, S2, S3, S4, S5, S6, S7, S8. P. andina haplotypes are bolded. Trees have been rooted with P. phaseoli. Bootstrap support values obtained by maximum likelihood are shown above branches and Bayesian posterior probabilities are shown below branches. Values are not shown for branches that had less then 80% support/probability by both methods.

