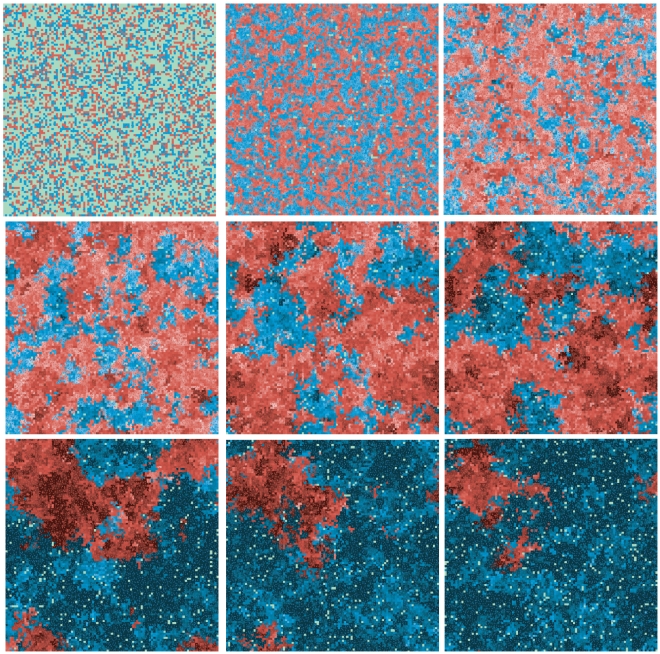
Figure 1. The spatial evolution of a typical run.
Blue squares correspond to a presence of an ager agent and red to the presence of a non-ager in that location. The figures show the same realization of the problem at different times, from the beginning (top left), evolving from left to right and then from top to bottom. Both for blue and red, lighter tones indicate a smaller fitness, while darker tones correspond to a higher fitness. Green spots correspond to places where no living agent is present.

