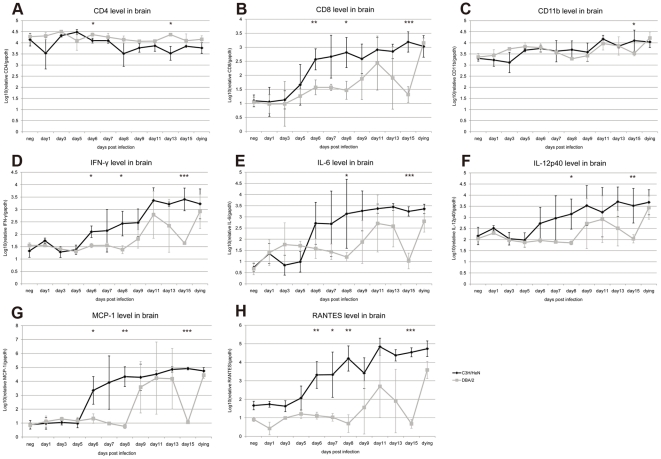
Figure 3. Relative mRNA levels of antigen markers specific for inflammatory responses in the brain of infected mice.
Relative levels of mRNA from CD4, CD8 and CD11b cell markers (A, B, C) were calculated. Cytokine mRNA levels were tested for IFN-γ, IL-6, IL-12p40 (D, E, F) and chemokines MCP-1 and RANTES (G, H). All mRNAs were standardized with GAPDH and presented in log10 means ± standard deviation for three mice tested on the same day. mRNA expression in C3H/HeN mouse brain tissue is represented by black spots and in DBA/2 mouse brain by light grey squares. All samples were tested three times. *, p<0.05; **, p<0.01; ***, p<0.001 for comparisons between the two mouse strains.

