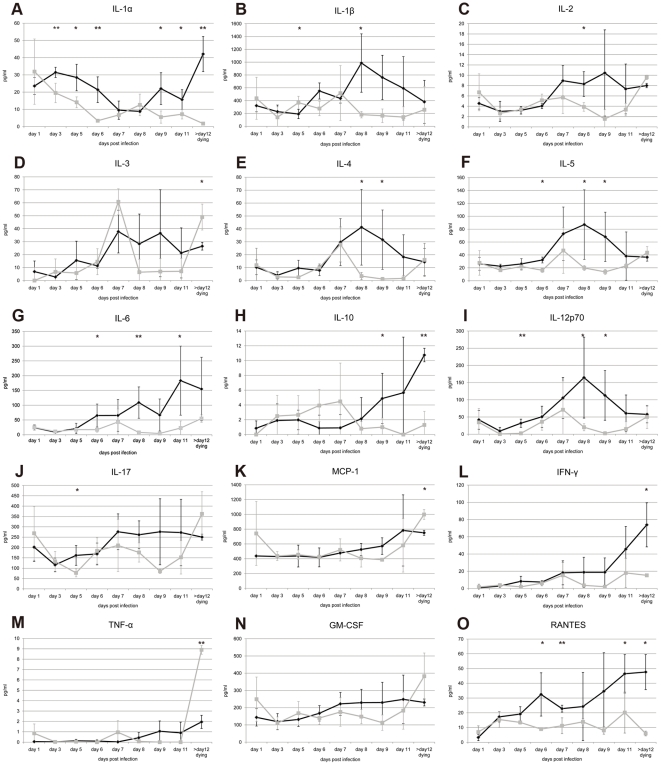
Figure 4. Cytokine and Chemokine levels in serum of JEV-infected mice.
Cytokines were measured using the Q-Plex™ Mouse Cytokine array and were compared with the standard samples in the kit. Black spots at indicated times signifies the mean values of three C3H/HeN mice and grey spots indicate those of DBA/2 mice. Standard deviation bars are presented for the three mice tested on the same day. MIP-1α that showed only a negligible amount is not presented. *, p<0.05; **, p<0.01 for comparisons between the two mouse strains.

