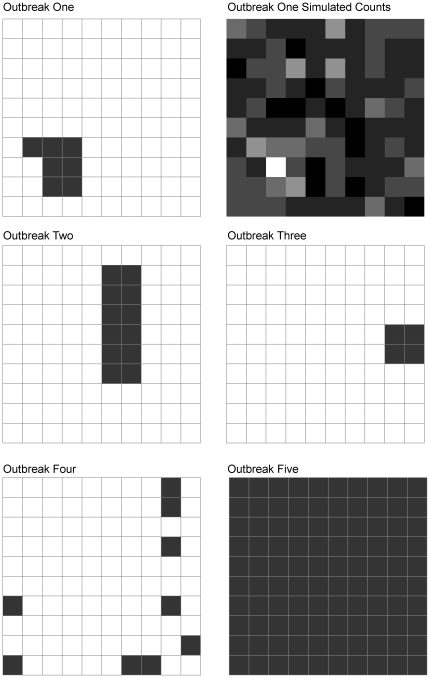
Figure 3. Simulated outbreak patterns in a hypothetical surveillance system.
White cells generated under model for state one, and black cells generated under model for state two. The count data that was simulated using outbreak one is also shown: dark colours indicate low counts and lighter colours indicate high counts.

