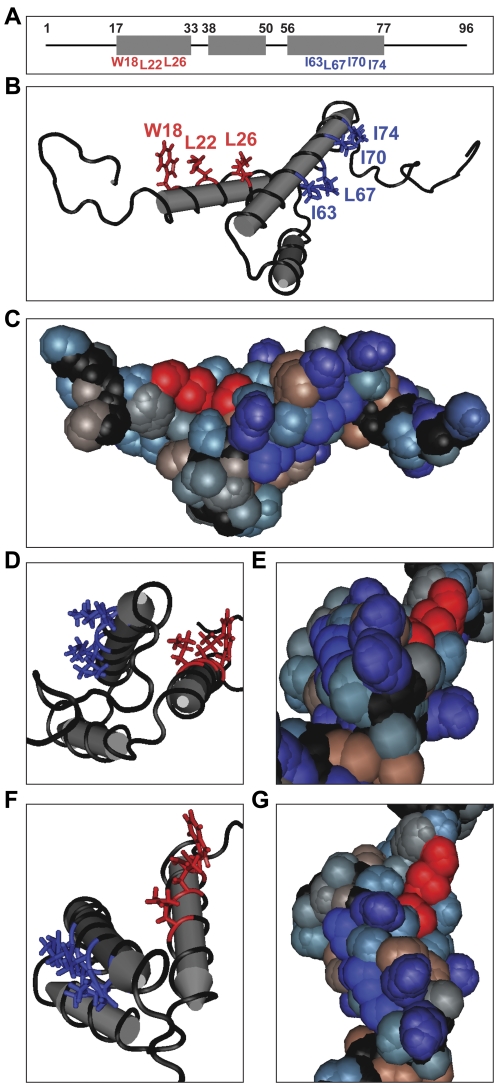
Figure 1. The NMR structure of Vpr shows solvent exposed hydrophobic residues along helices 1 and 3.
(A) A wire and box diagram of Vpr. The gray boxes represent the 3 helices of Vpr, and the upper set of numbers denotes the boundaries of each helix. The lower set of numbers identifies exposed hydrophobic residues along helix 1 and helix 3. (B) A tube diagram of the side view of the nuclear magnetic resonance (NMR) structure of HIV-1 Vpr (PDB: 1M8L) indicating hydrophobic amino acids exposed on the apparently solvent exposed surfaces of helix 1 (red) and helix 3 (blue). (C) A space filling diagram of the side view of HIV-1 Vpr using a hydrophobicity color scheme. The exposed hydrophobic residues along helices 1 and 3 are colored as in (B). Positively charged or polar amino acids with high hydrophilicity are colored light blue. Purple residues are negatively charged with high hydrophilicity. Polar amino acids with low to neutral hydrophobicity are gray, and highly hydrophobic, nonpolar residues are brown. The α-carbon peptide chain is black as in (B). (D) C-terminal end view of HIV-1 Vpr helical core indicating the hydrophobic patches colored as in (B). (E) A space filling end view as in (D) colored as in (C). (F) Top view of HIV-1 Vpr helical core indicating the hydrophobic patches colored as in (B). (G) Top view of HIV-1 Vpr using a space filling diagram colored as in (C).

