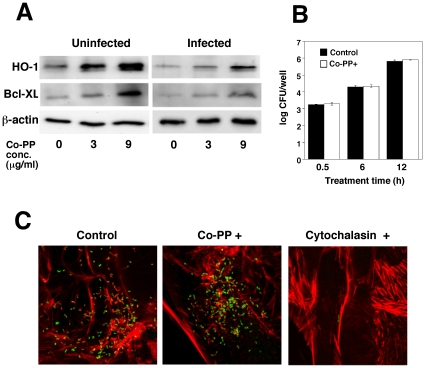
Figure 1. Decreased HO-1 and Bcl-XL expression in TG cells infected with L. monocytogenes.
(A) TG cells were first treated with Co-PP and then infected with L. monocytogenes. The infected cells were cultured in 50 µg/ml of gentamicin. After 6 h, HO-1 and Bcl-XL expression was analyzed by immunoblotting. A representative immunoblot of three independent experiments is shown. (B) TG cells were treated with Co-PP and then infected with L. monocytogenes. The infected cells were cultured in 50 µg/ml of gentamicin. After 0.5, 2, and 6 h incubation, the infected cells were washed with PBS and lysed with cold distilled water. CFU were determined by serial dilution on BHI agar plates. (C) L. monocytogenes was deposited on TG cells by centrifugation at 150×g for 10 min at room temperature, incubated for 6 h, fixed, and stained. The figure shows FITC-labeled bacteria (green) and Alexa Fluor 594-labeled actin filaments (red) merged images. The left-hand panel shows untreated cells, the center panel Co-PP (9 µg/ml)-treated cells, and the right-hand panel, cytochalasin D-treated cells.

