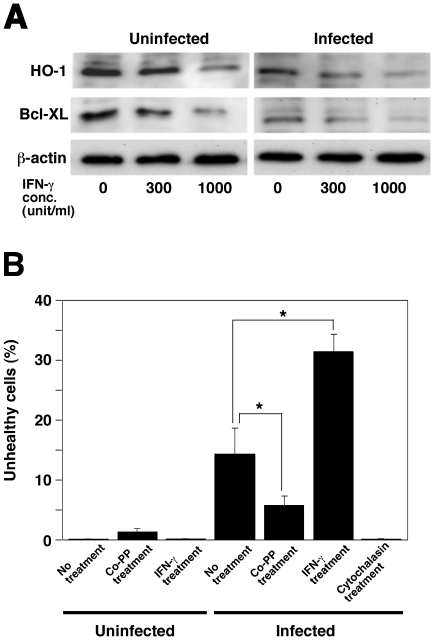
Figure 2. Induction of cell death by L. monocytogenes infection.
(A) TG cells were treated with IFN-γ (0, 300, and 1,000 units/ml) for 24 h and infected with L. monocytogenes for 6 h. HO-1 and Bcl-XL expression in TG cells was analyzed by immunoblotting. A representative immunoblot of three independent experiments is shown. (B) Cell death was determined using the JC-1 Mitochondrial Membrane Potential Assay Kit. One hundred TG cells per coverslip were examined to determine the total number of live or dead cells. All values represent the average and the standard deviation of three identical experiments. Statistically significant differences compared with the control are indicated by asterisks (*, P<0.05).

