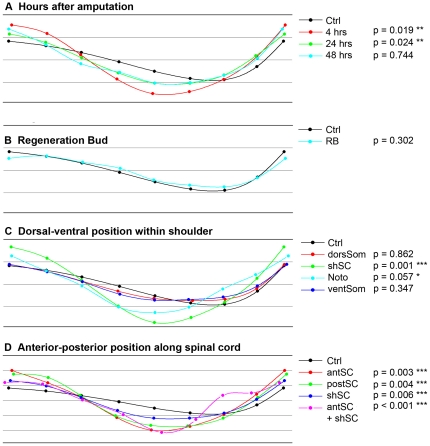
Figure 5. Procrustes profiles of tail morphology after laser treatment.
The nine points in all profiles represent the average position of the landmarks used to describe the shape of the regenerate (see Fig. 1E). In all cases the control refers to tails that have regenerated after amputation and all other profiles refer to regenerates after amputation and laser treatment. The numbers next to the legend are the probability that the profile will have that shape. If the P value is <0.05 then we assume the shape is statistically different from the control. The profiles and P values were calculated using Morphometric Geometrics as described in Supporting Information S1. (A) Compares the Procrustes profiles for insults to the shoulder spinal cord (shSC) for different hours post amputation (hpa). (B) Insults to the regeneration bud (RB) are shown not to affect regeneration. (C) For insults along the DV axis, only insults to the shSC and notochord (Noto) were significantly different from the control. Insults to the dorsal somite (dorSom) and ventral somite (ventSom) produced similar regenerates as the controls. (D) Profiles of insults along the AP spinal cord axis. The further anterior the damage, the greater the difference from the control. Even larger shape changes were observed in regenerates that had laser damage at two locations, anterior spinal cord (antSC) and shSC. *** indicates p<0.01, ** indicates p<0.05, * indicates p<0.1.

