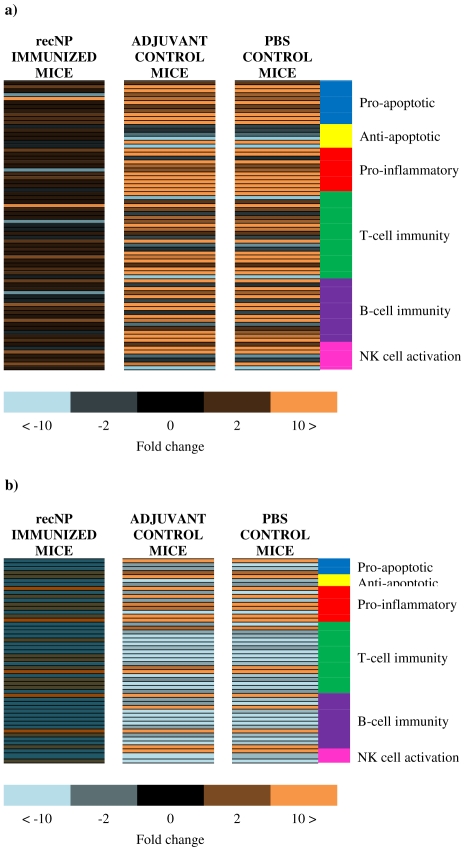
Figure 4. (a–b). Heat maps showing fold changes in liver and spleen at 72 hours after RVFV infection.
Expression of genes in RecNP immunized, adjuvant control and PBS control mice are organized according to function. Livers are indicated in panel a, and spleens in panel b. The genes shown in orange are upregulated, those in blue are downregulated and those in black or darker shades of orange and blue have fold-change values between −2 and 2 and/or have p-values>0.05.

