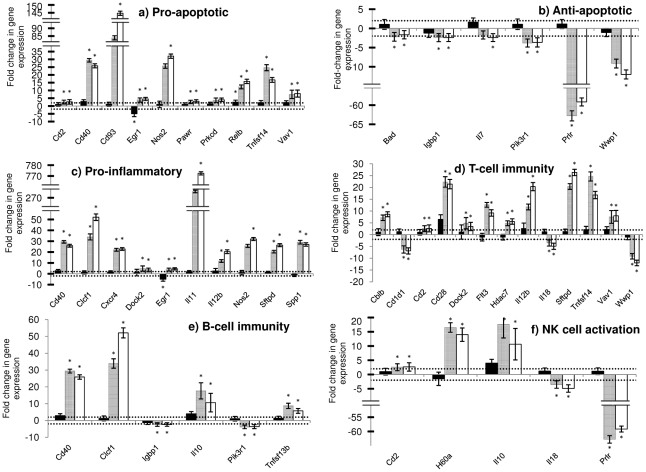
Figure 5. (a–f). Fold changes in expression of genes in the liver of experimental groups at 72 hours after RVFV infection.
RecNP-immunized mice (n = 3) are indicated by solid black bars, adjuvant control mice (n = 3) by grey bars and PBS control mice (n = 3) by white bars. The horizontal dotted lines indicate the cut-off values for upregulation (+2) or downregulation (−2). The asterisk (*) indicates where the P-value is smaller than or equal to 0.05 (statistically significant results). Standard deviation from the mean fold changes are indicated by the error bars.

