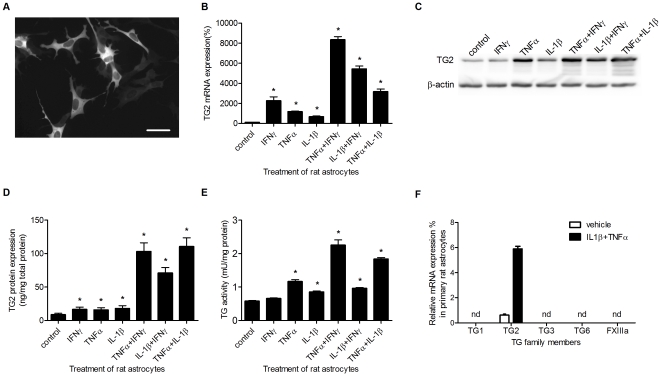
Figure 1. TG2 expression in primary rat astrocytes.
A) TG2 is expressed in primary rat astrocytes as visualized by immunocytochemical analysis. Scale bar: 50 µm. B) TG2 mRNA expression after treatment with various single cytokines or with cytokine combinations. C) TG2 protein expression visualized by western-blot and D) measured with ELISA. E) TG2 activity levels measured with the TG Covtest TCMA. F) mRNA levels of transglutaminase (TG) family members in primary rat astrocytes. Data are expressed as mean+s.e.m., n = 6 per condition (F: n = 3 per condition), *P<0.05 compared to control, nd = not detectable.

