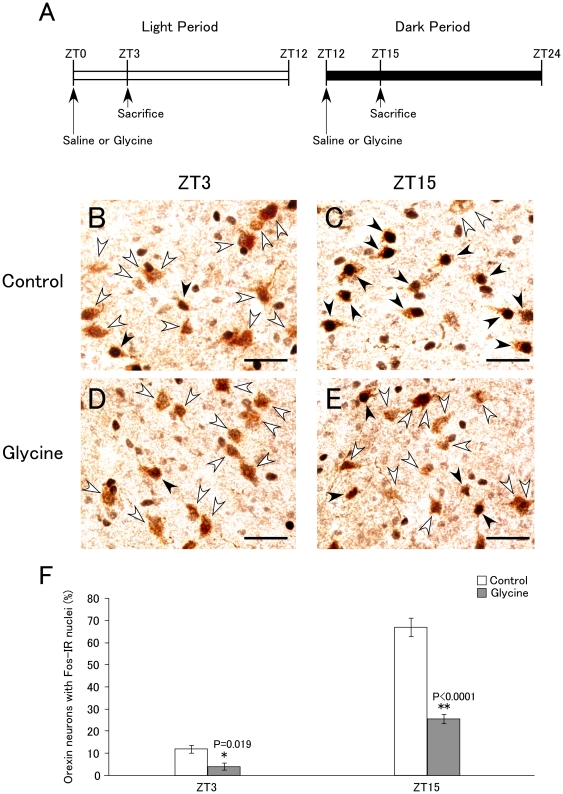
Figure 2. Effects of glycine administration to mice on activity of orexin neurons.
A. Protocols for glycine administration in light (left panel) or dark period (right panel). Glycine or saline was injected intraperitoneally at ZT0 or ZT12, and then mice were sacrificed at ZT3 or ZT15. B–E, Representative immunohistochemical micrographs of double-staining with anti-c-Fos (black) and anti-orexin A (brown) antibody at ZT3 (B, control (saline); D, glycine (2 g/kg)) and at ZT15 (C, control; E, glycine). White arrowheads show orexin-immunoreactive cells. Black arrowheads show orexin neurons with Fos-immunoreactivity in their nuclei. Scale bar, 20 µm. F. Percentage of c-Fos-expressing orexin neurons at ZT 3 (control; n = 3, glycine; n = 4) and ZT 15 (control; n = 4, glycine; n = 6). Values are mean ± SEM. *p<0.02, **p<0.0001.

