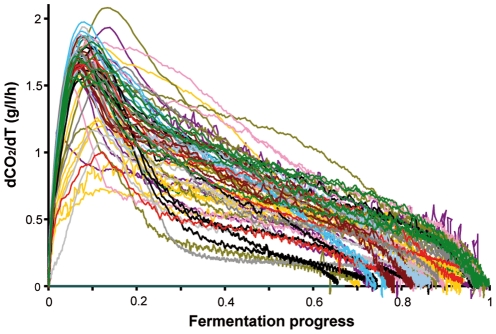
Figure 1. Comparison of the fermentation profiles for 72 S. cerevisiae strains fromdiverse geographical locales and environments.
Fermentations were carried out in synthetic medium containing 240 g/L glucose, 200 mg/L nitrogen, pH 3.5. The fermentation profiles are presented as the CO2 production rate vs. the fermentation progress, which corresponded to the ratio of consumed glucose to initial glucose. The lines are colored according to the origin of the strains: vineyard (purple), soil (grey), sake (light grey), palm wine (pink), oak (brown), laboratory (yellow), fruit (red), wine commercial (dark green), Bertam-palm (blue), baker (black), beer (dark grey), cactus (light blue).

