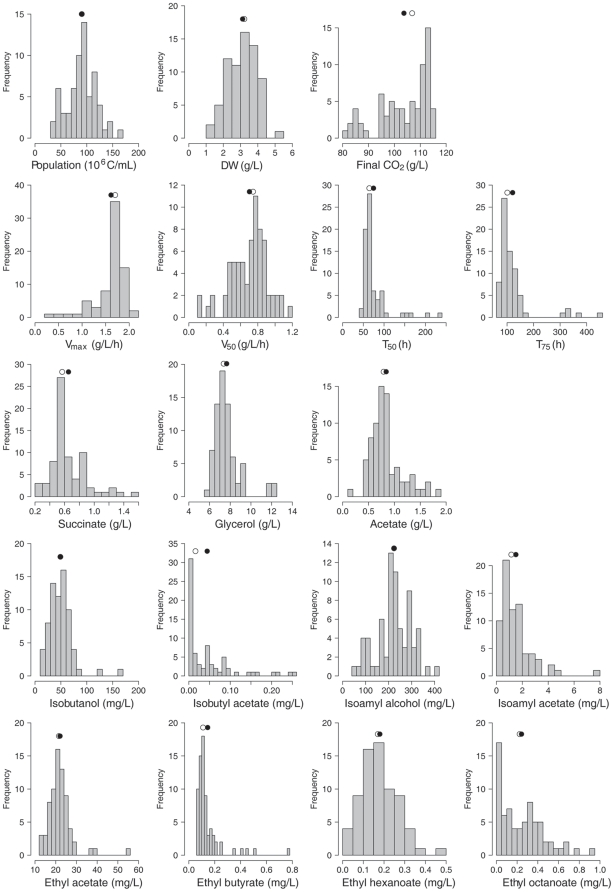
Figure 2. Distribution frequency of the phenotypic variables in the total population (72 strains).
Closed circle: mean value; open circle: median value. Kinetics variables (CO2F, Vmax, V50, T50 and T75) were determined from the fermentation curves. Growth (cell number and dry weight) and metabolic variables (glycerol, acetate, succinate, two higher alcohols, two acetate esters and four ethyl esters) were measured when 75% of the sugars were consumed (180 g/L).

