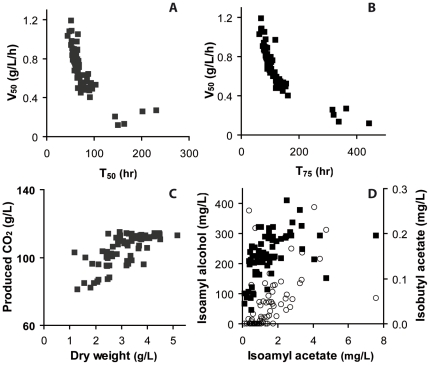
Figure 3. Relationships between the phenotypic variables within the total population of strains.
Correlations were found between: the fermentative activity at mid-fermentation V50 and the time necessary to consume 50% or 75% of sugars, T50 (A) and T75 (B), respectively; the final CO2 release and the dry weight (C); and the production of isoamyl acetate and the productions of isoamyl alcohol (▪) and isobutyl acetate (○) (D).

