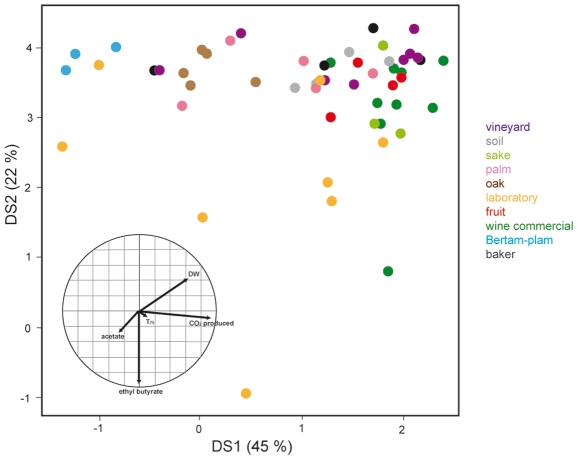
Figure 5. Linear discriminant analysis (LDA) of the population based on five discriminating phenotypic traits.
A linear discriminant analysis was applied to the most discriminating variables: dry weight, T75, CO2F, acetate and ethyl butyrate measured for 53 strains representing 10 different groups. Clinical isolates were not included, due to the large phenotypic variability observed among the strains in this group. Beer and cactus groups, with only two strains each, were removed for this analysis. Groups of origin include vineyard (purple), soil (grey), sake (green), palm wine (pink), oak (brown), laboratory (yellow), fruit (red), wine commercial (dark green), Bertam-palm (dark blue), baker (black).

