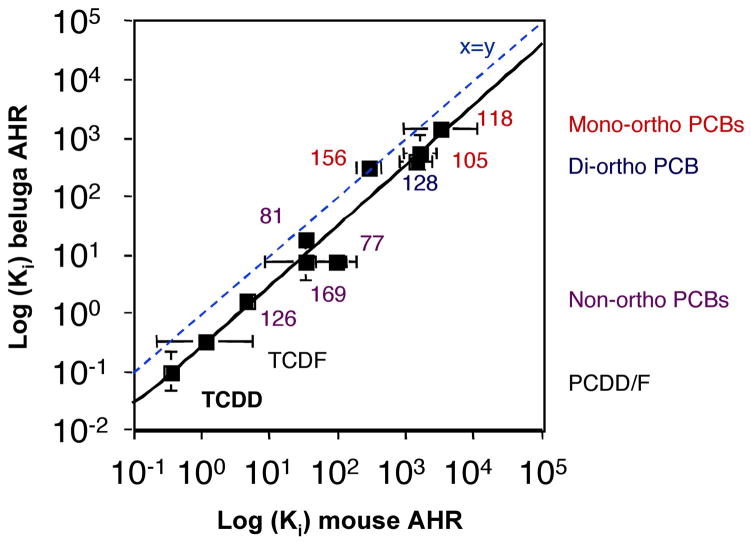
Figure 2. Log plot of beluga and mouse AHR Ki for various HAH.
Log[Ki] derived from competitive binding of [3H]TCDD to beluga and mouse AHR are plotted for each HAH examined. The equation of the line for log mouse Ki vs log beluga Ki is y = 1.03x - 0.54. The dashed line indicates y=x. Bars represent 95% confidence interval.

