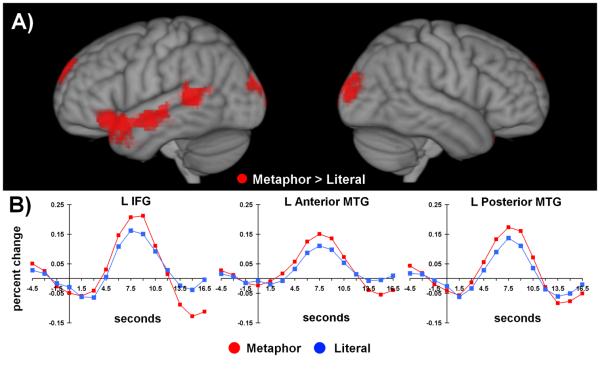
Figure 1.
Activation to metaphors and literal sentences. A. Regions in which metaphors elicited significantly greater activation than literal sentences (red). All displayed activations are thresholded, p<.01, GRF cluster corrected. There were no regions in which literal sentences elicited significantly more activation than metaphors. B. Hemodynamic responses to metaphors (red) and literal sentences (blue) from the clusters of activation in left inferior frontal gyrus (IFG, left), left anterior middle temporal gyrus (MTG, middle), and left posterior middle temporal gyrus (right).

