
Fig. 1.
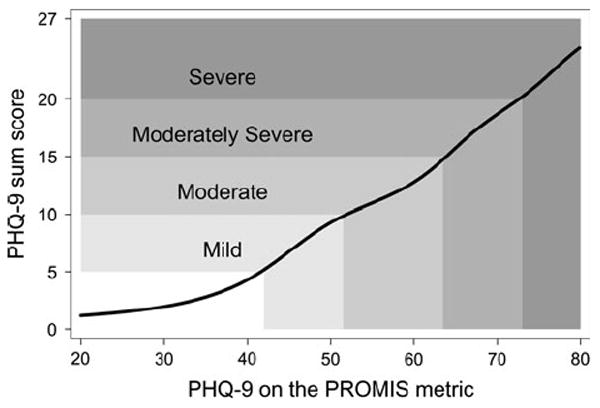
The test characteristic curve shows the most likely PHQ-9 sum score (on the y-axis) corresponding to an IRT-based PHQ-9 score (x-axis), which has been calibrated to the PROMIS metric. Horizontal lines indicate the published PHQ-9 cutpoints for mild (5–9), moderate (10–14), moderately severe (15–19) and severe (20–27) depression. Mild depression (PHQ-9 score of 5–9) corresponds to scores of 42–51 on the PROMIS metric, moderate depression to 52–63, moderately severe to 64–72, and severe to scores of 73 and higher