
Fig. 2.
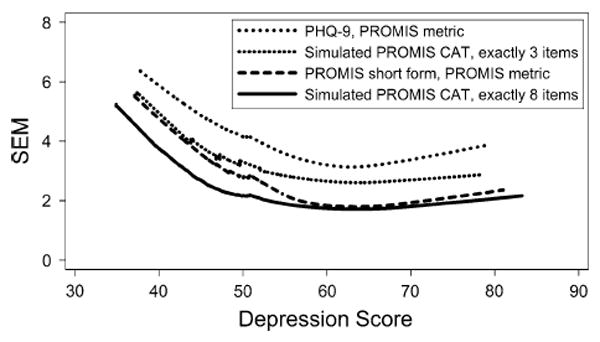
Lowess curves for the standard error of measurement (SEM) by depression symptom score. All the PROMIS scores, including the simulated 3-item CAT, are more precise (have smaller SEM) than the PHQ-9. In the absence of other criteria, an SEM of 0.3 SD, here equal to 3, is often used as an acceptable level of precision