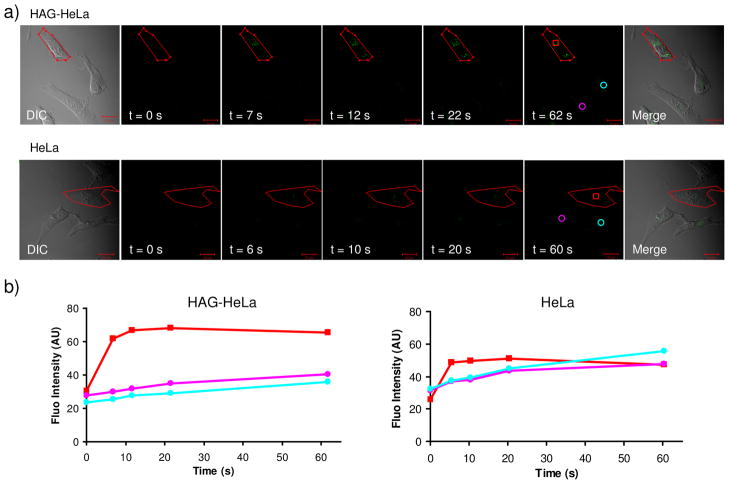
Figure 7.
Spatiotemporally controlled imaging of HAG-labeled proteins in live HeLa cells: (a) DIC (panel 1), time-lapsed fluorescence (panels 2–6), and merged DIC/fluorescence (panel 7) images of HAG-encoded HeLa cells (top row) and normal HeLa cells (bottom row) upon two-photon illumination. All cells were treated with 200 μM of tetrazole 16. A 5-sec two-photon 700 nm laser was applied to the red encircled area in panels 1 sketched using the LSM-510 software. Scale bar = 20 μm. (b) Time courses of fluorescence development in cytosolic regions in select HeLa cells as indicated in panels 6: red square denotes the subcellular regions that were subjected to two-photon activation; cyan and purple circles denote the regions in the surrounding cells that were not subjected to two-photon activation.

