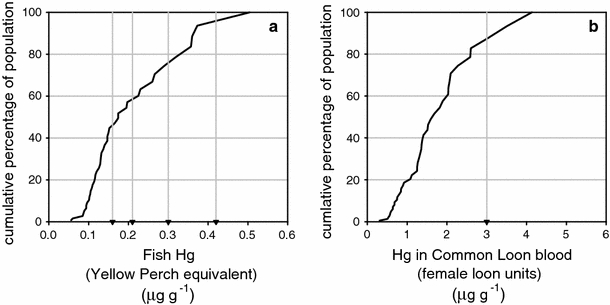
Fig. 3.

Mean Hg concentrations in fish (whole body, yellow perch equivalent values, μg g−1, ww; a and common loons (blood, female loon unit values, μg g−1; b for the cumulative distribution of lakes sampled. The gray vertical lines in the fish population plot a represent the threshold values of 0.16, 0.21 and 0.42 μg g−1 for adverse effects on common loon and 0.30 μg g−1 for the USEPA fish consumption advisory criterion. The gray vertical line in the loon population plot b represents the threshold concentration of 3.0 μg g−1 for the health concern criterion for the common loon
