
Figure 7.
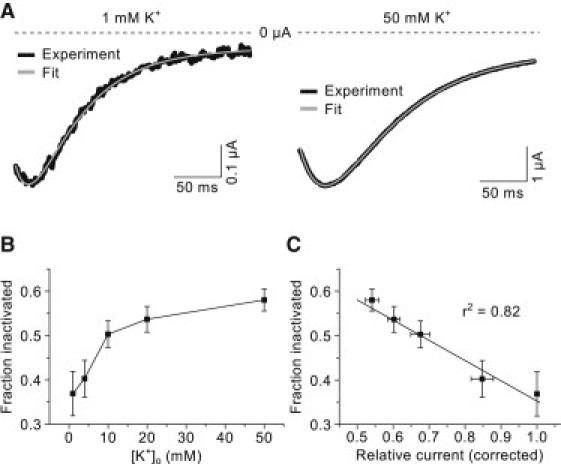
ODE analysis of tail currents at various concentrations of potassium. (A) Representative tail currents (solid) measured at −120 mV after a 3-s depolarizing step at 40 mV in 1 and 50 mM [K+]o as indicated. Only the initial 250 ms are shown. The voltage protocol is shown in the inset in Fig. 3A. (Dashed lines) Zero current level. The fits obtained with the ODE model are also shown (shaded). (B) Fraction of inactivated channels estimated from the model fits. (C) Correlation between fraction of inactivated channels and the corresponding relative current amplitudes (corrected for the theoretical reduction). The data are grouped by potassium concentration. The regression line (solid line) and the regression coefficient are also shown.