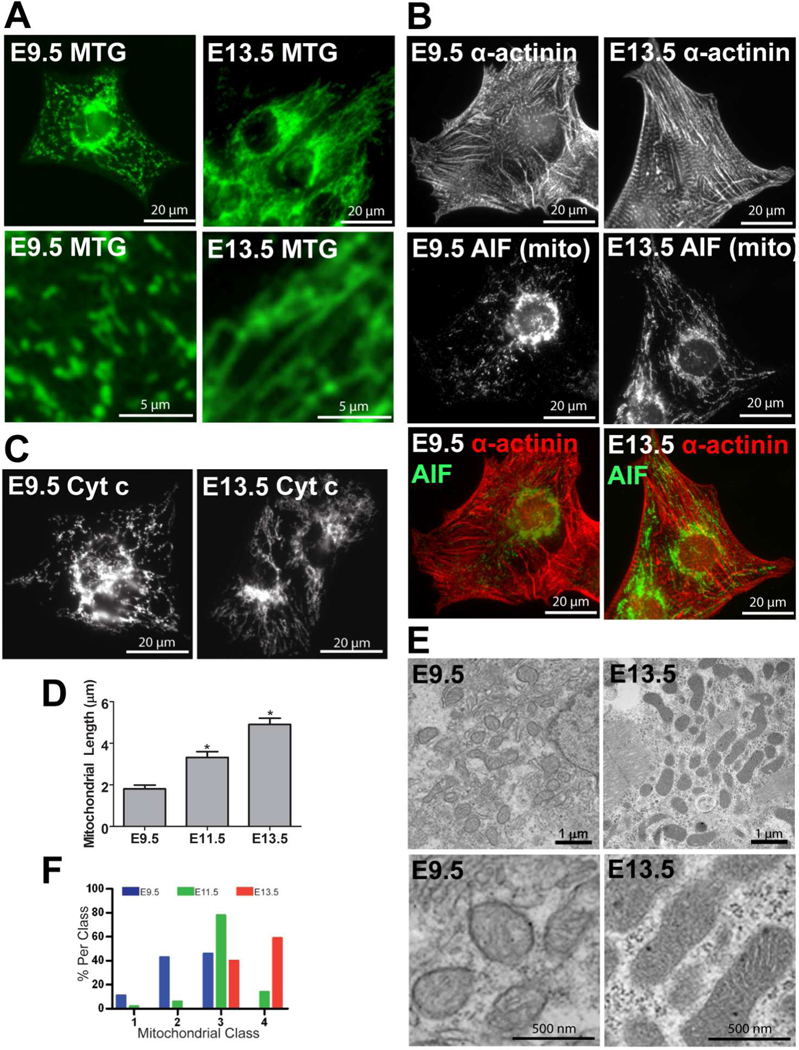
Figure 1. Mitochondrial morphology changes during cardiac development.
(A) Epifluorescence microscopy of MTG in live cultured ventricular myocytes at ages E9.5 and 13.5. (B) Fixed myocytes stained for α-actinin in the contractile apparatus and AIF in mitochondria. (C) Fixed myocytes stained for cyt c in mitochondria. (D) Measurements of mitochondrial length in cultured WT E9.5, 11.5, and 13.5 myocytes (*P<0.05 compared to E9.5). (E) Transmission electron micrographs from WT E9.5 and 13.5 hearts. (F) A histogram of mitochondrial ultrastructure classes from electron micrographs from ventricular myocytes of WT E9.5, 11.5, 13.5 hearts. The weighted classifications were significantly different among the three ages (P<0.05).

