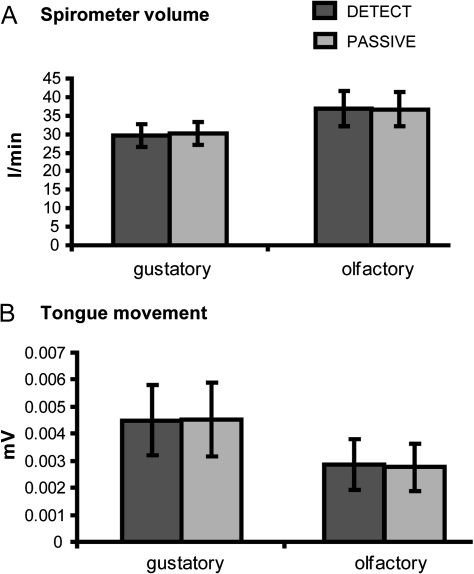
Figure 4.
Spirometer volume and tongue movement. (A) Average spirometer volume (in l/min) across subjects (±standard error of the mean) for the detection task condition (dark gray bars) and the passive task condition (light gray bars) for the 2 modalities. (B) Average tongue movement (in microvolts) across subjects (±standard error of the mean) for the detection task condition (dark gray bars) and the passive task condition (light gray bars) for the 2 modalities.

