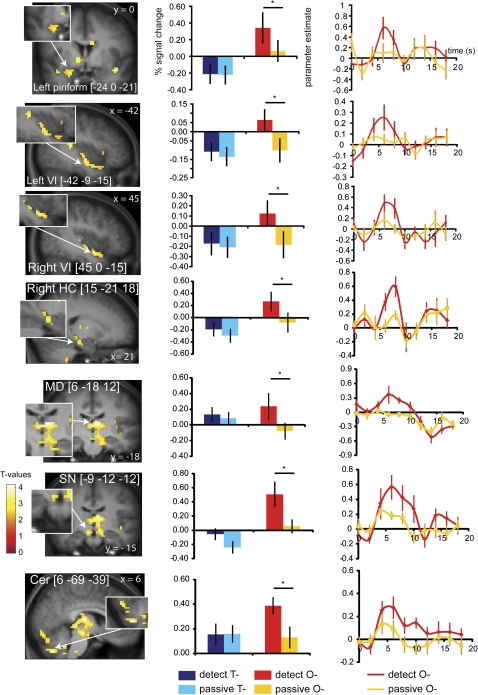
Figure 6.
Neural responses in the piriform cortex, ventral insula (VI), (para)hippocampal gyrus (HC), mediodorsal thalamus (MD), substantianigra (SN), and cerebellum (cer) during attention to odor. Coronal and sagittal sections show areas that respond to DETECT O− minus PASSIVE O−. The bar graphs next to the sections show the percent signal change in the voxel responding maximally to DETECT O– (red) PASSIVE O– (orange) (averaged over subjects, ±standard error of the mean) in the same area. Percent signal change to DETECT T– (dark blue) and PASSIVE T− (light blue) is also illustrated for this voxel. The asterisk denotes the conditions that differ significantly (DETECT O− and PASSIVE O−). The line graph next to the bar graph displays the time course of the signal for DETECT O– (red) and PASSIVE O– (orange) in this area (parameter estimate in arbitrary units [±standard error of the mean], averaged over subjects). Insets depict which areas show responses that are specific to DETECT O− minus PASSIVE O− and not to DETECT T− minus PASSIVE T−. The color bar depicts the scale of T− values in the contrast map. The map is thresholded at P < 0.005.

