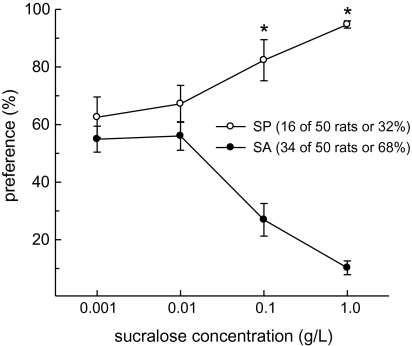
Figure 5.
Approximately twice as many male Long–Evans rats were classified as SA, relative to SP, on the basis of their behavioral responses to 2-bottle 24-h preference tests involving water and an ascending series of sucralose concentrations. Data are mean (±SEM) preference scores (sucralose intake divided by total fluid intake, expressed as percentages). Preference for sucralose increased among SP and decreased among SA, as a function of increasing sucralose concentration. Group differences were detected at the 2 highest sucralose concentrations. *SP > SA, Ps < 0.001.

