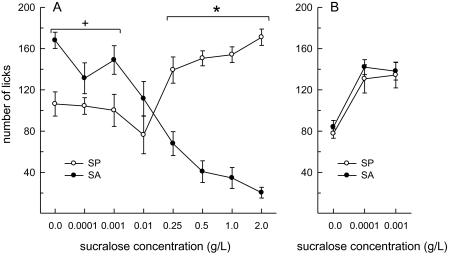
Figure 6.
Sucralose-elicited licking behavior during brief (30 s) access tests differs in SA and SP. Data are mean (±SEM) number of licks/30-s presentation. Rats were classified as either SP or SA on the basis of their bimodal behavioral responses to the highest concentration of sucralose. (A) SP licked more and SA licked less, as a function of increasing sucralose concentration. SA licked more than SP to the 3 lowest concentrations and SP licked more than SA to the 4 highest concentrations. (B) A retest of the licking curves generated by the 3 lowest concentrations revealed no differences between SA and SP, suggesting that the earlier group differences at these concentrations were the result of a contrast effect across between low and high sucralose concentrations across the full range of concentrations tested in (A). +SA > SP, Ps < 0.05. *SP > SA, Ps < 0.05.

