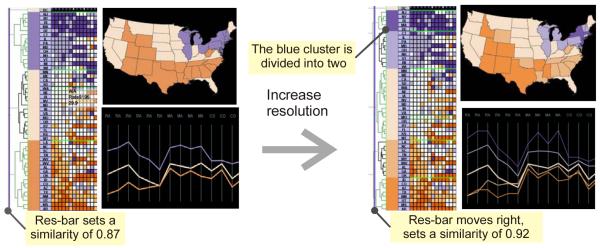
Figure 4.
Resolution control process: initially the entire dataset is abstracted into three clusters (left); as resolution is increased, the dataset is abstracted into five clusters (right). The matrix overview remains the same, exposing structural patterns; while the dr-views provide additional perspectives: the PCP displays multivariate characteristics of the clusters; the GeoMap displays the geographic distribution of the clusters. To save space, only a subset of variables is displayed.

